Easily Measure DORA Metrics with Opsera Unified Insights
Measure DORA metrics with Opsera’s Unified Insights to pinpoint strengths and weaknesses in your DevOps pipeline. Gain a holistic view across tools, teams, and environments, identifying areas to accelerate deployment, shorten recovery times, improve change failure rate, and lead time for changes.

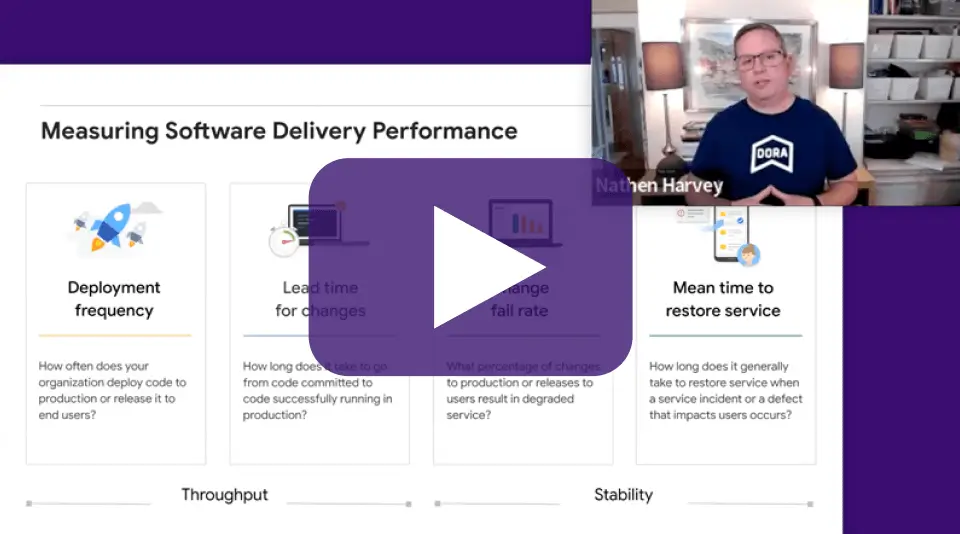
Accelerate Velocity, Throughput, and Productivity with DORA
What is DORA?
DORA is a set of four key metrics developed by the DevOps Research and Assessment (DORA) team drawn from comprehensive research that measures the performance and health of software delivery teams. These metrics help organizations assess their DevOps practices and identify areas for improvement.
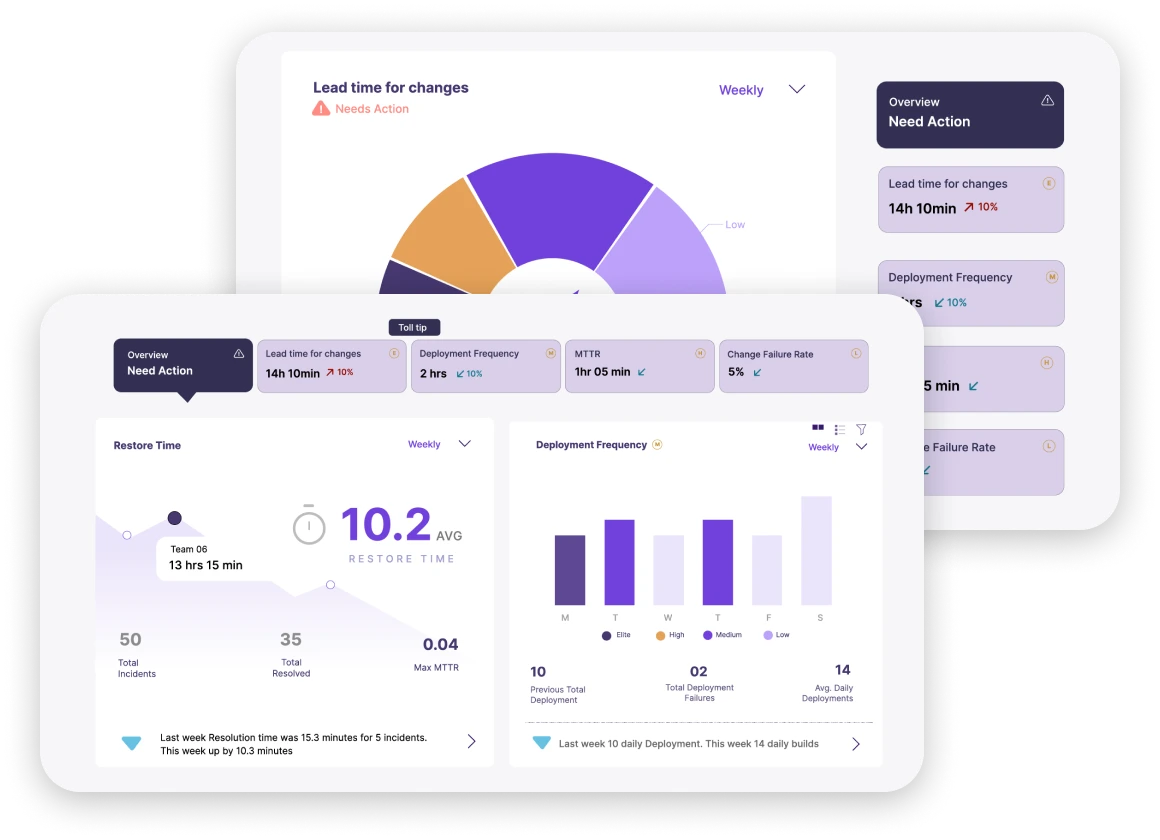
How Does Opsera Measure DORA?
Opsera helps teams measure DORA from across the organization. With the Unified Insights found in Opsera’s DevOps Platform, organizations can measure across all tools, teams, and environments, to help make better decisions and improve productivity and accelerate velocity.
Gain End-to-End Visibility
Opsera centralizes data from various DevOps tools and pipelines, providing a unified view of the entire software delivery lifecycle. This comprehensive view allows teams to identify bottlenecks, track progress, and make data-driven decisions.
Troubleshoot Faster
By offering contextualized logs, Opsera helps users diagnose issues quicker. Our platform allows searching by build number, viewing logs from all involved tools, and accessing root cause analysis (RCA) data, streamlining the troubleshooting process.
Improve Efficiency
Unified Insights boosts team efficiency by eliminating the need to switch between different tools for data analysis. This centralized platform can potentially save time and minimize context switching.
Enhance Decision Making
With access to consolidated data and insights, stakeholders can make informed decisions about resource allocation, pipeline optimization, and other crucial aspects of the software delivery process.
The latest DORA report is the most comprehensive and up-to-date study of software delivery performance in the world.
Measure Mean Time to Resolution
Opsera Unified Insights tracks incidents from start to finish, pinpointing the exact time it takes to resolve them. This Mean Time To Resolution (MTTR) helps DevOps teams identify bottlenecks in their incident response process. By pinpointing areas for improvement, teams can resolve issues faster, minimizing downtime and ensuring a smoother user experience.

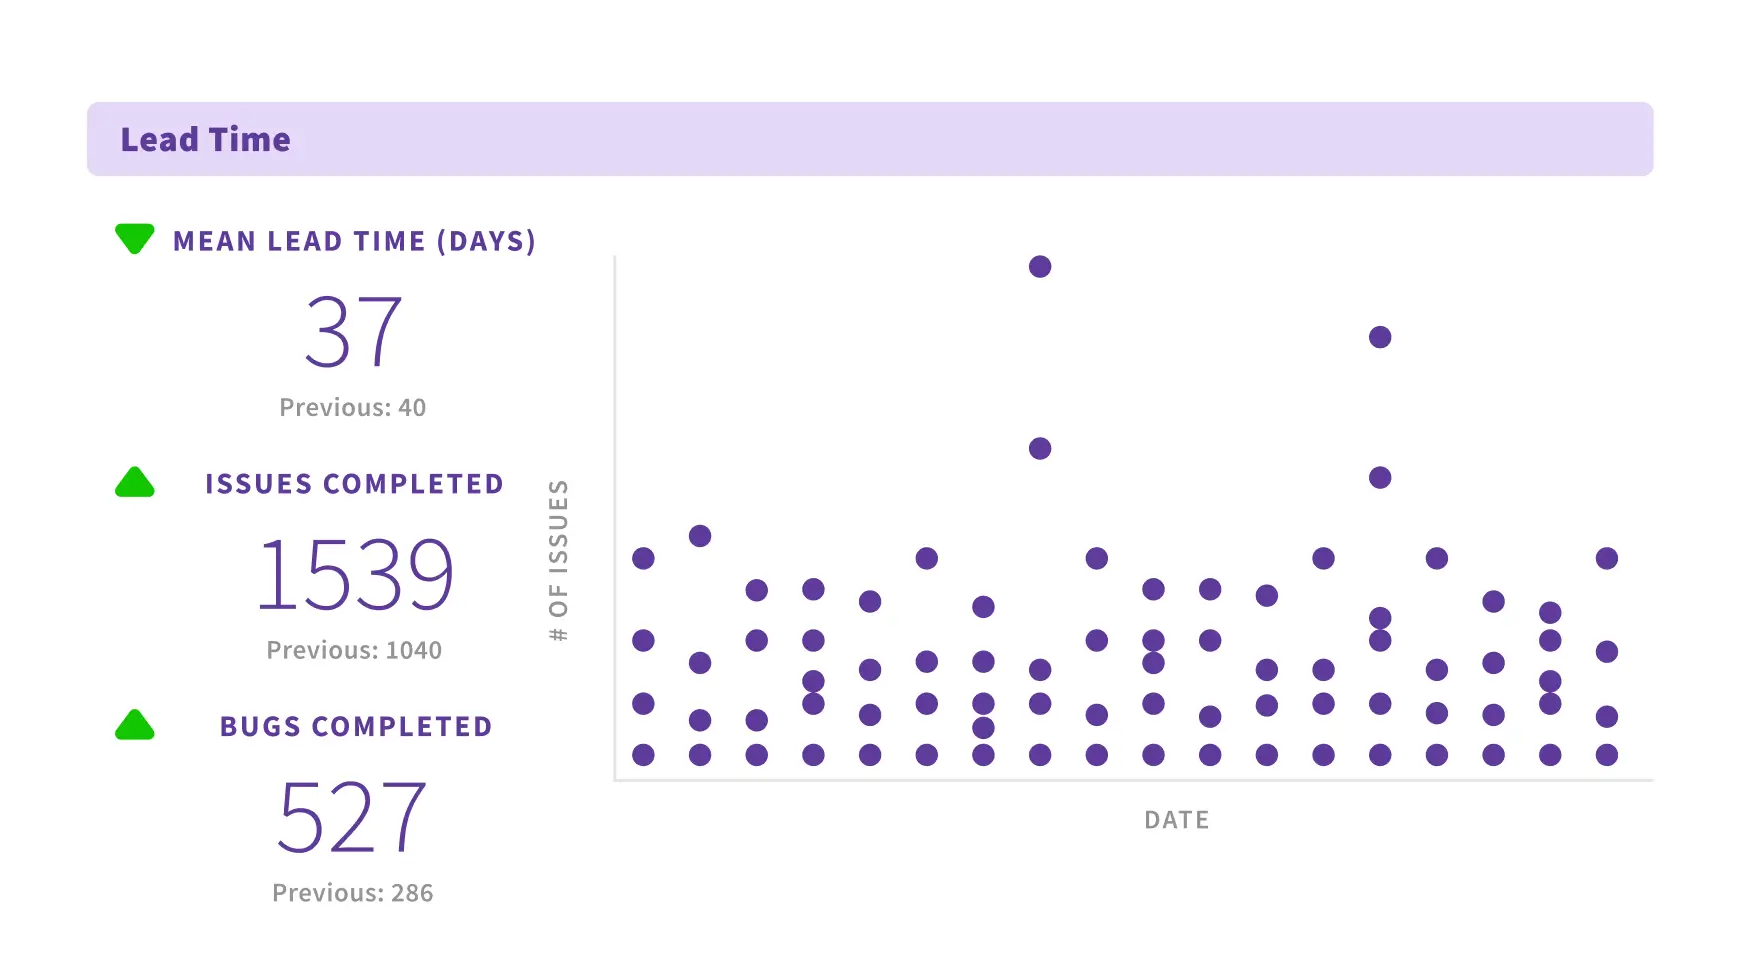
Track Lead Time for Changes
Opsera Unified Insights tracks your code commits and deployment timestamps to calculate lead time, the total time to get a change to production. This helps measure how fast your team delivers features. Faster lead times mean quicker response to customer needs and a competitive edge.
Understand DORA at Scale
Opsera’s Unified Insights tracks DevOps performance across your entire organization using the DORA metrics:deployment frequency, lead time for changes, mean time to restore, and change failure rate. This unified view helps pinpoint bottlenecks and areas for improvement. By streamlining deployments, reducing rework, and improving recovery times, you can deliver features faster and more reliably.


Track Deployment Frequency
Track your deployments across various tools, giving you a central view of how often you push code to production (deployment frequency). This is crucial because high deployment frequency lets you deliver features faster, identify issues early, and improve overall software quality.
Software delivery performance —
a balance of velocity and stability
Improve stability
< 15%
Change fail rate
Percentage of code deployments causing a failure in production
< 1 hour
Mean time to restore service
Amount of time it takes an organization to recover from a failure in production

Double velocity
QD
Deployment frequency
Frequency of successful deployments of code over the given date rang
<1 Day
Lead time for changes
Amount of time it takes a code change to get into production
Opsera Unified Insights empowers enterprises to improve developer productivity and experience.
Partnerships
- Tech and GTM Partnership with GitHub
- DORA Partnership with Google (Opsera sponsored 2023 state of DevOps report)
- Tech partnerships with prominent vendors in DevOps and DevSecOps
Unified DevOps Platform
- Single pane of Glass for DevOps environment (SDLC & SaaS)
- End-to-End Visibility across DevOps and DevSecOps ecosystem
- 100+ Tools Integrations
Patented Technology
- Persona Based Insights for DevOps
- Transforming the data across DevOps/DevSecOps with predictive insights and anomaly detection
- Tool Chain Automation
- Pipelines using Drag and Drop Mechanism
Industry Recognition
- Opsera helped creating the “Unified DevOps platform” Category
- Gartner included Opsera in the 2023 MQ for DevOps Platform : Published 05 June 2023 – G00782953